1. Multi-core design optimization
The recent progresses include:
(1) make change on SimpleScalar to accurately estimate the L2 datacache
overlap factor, in order to reduce the previous estimation error for
benchmarks with large L2 dcache miss rate. So far the results is not
very promising. For a couple of configurations, the error is as small as 13%,
but for some other configurations, the error can be as large as
90%. This problem is more severe when main memory latency increases.
Such latency used in Luke's experiment is smaller than mine so the
error was not serious. I think further analysis is necessary.
(2) build up model for another 20 benchmarks in SPEC2000.
(3) download and study the Orion simulator for network-on-chip

2. Power and thermal management for network processor

Two problems can be studied:
(1) Intra-core simultaneous thread scheduling and voltage
scaling problem:
  Network processors have to read/write large number of data
and tend to be memory-bounded. Therefore, most of network
processors implement SMT technique to reduce the impact of
memory latency. However, SMT increases the activity of
the core and leads to high temperature.
  There are two methods for SMT core in thermal management:
one is to turn off a number of threads, and reduce the activity
of the core; another is to reduce the core voltage. Turnning off
threads increases the impact of long memory latency, but such
impact can be relieved by voltage scaling, because for a memory-bound
benchmark, reducing Vdd of computing core has little impact on
overall performance.
  Therefore, the problem can be summized as: for given temperature
constraint, decide the number of active thread and the Vdd of
the core, such that performance is maximized

(2) Energy minimization with QoS and thermal constraints
  In this problem we focus on the CMP. For a given QoS requirement,
we can either choose small number of cores with high Vdd, or large
number of cores with low Vdd, assuming all cores have the same Vdd.
Figure 1 shows the temperature (estimated as power/core) and total
energy curves, for the same QoS requirement. It is easy to see the
as core number increases, temperature drops but total energy
increases.
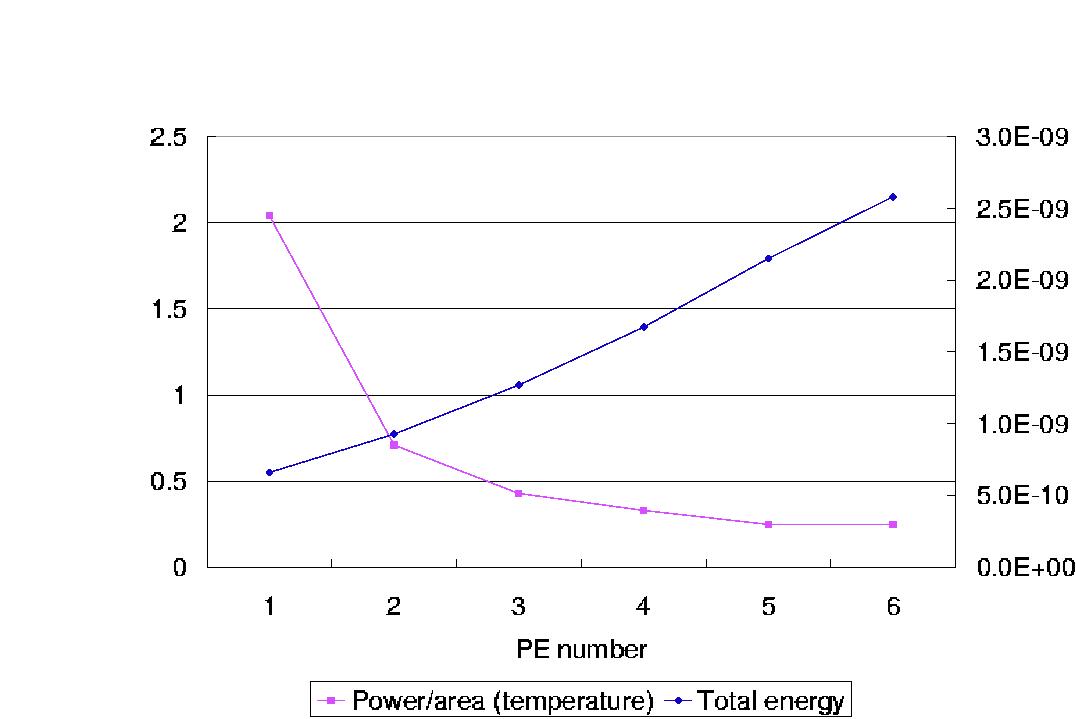
Figure 1: Curves with the same performance requirement.
Figure 2 shows the iso-QoS and iso-temperature curves. The cross
point of an iso-QoS and iso-temperature curves indicates the
number of PE to turn on and the Vdd for each PE such that total
energy is minimized.
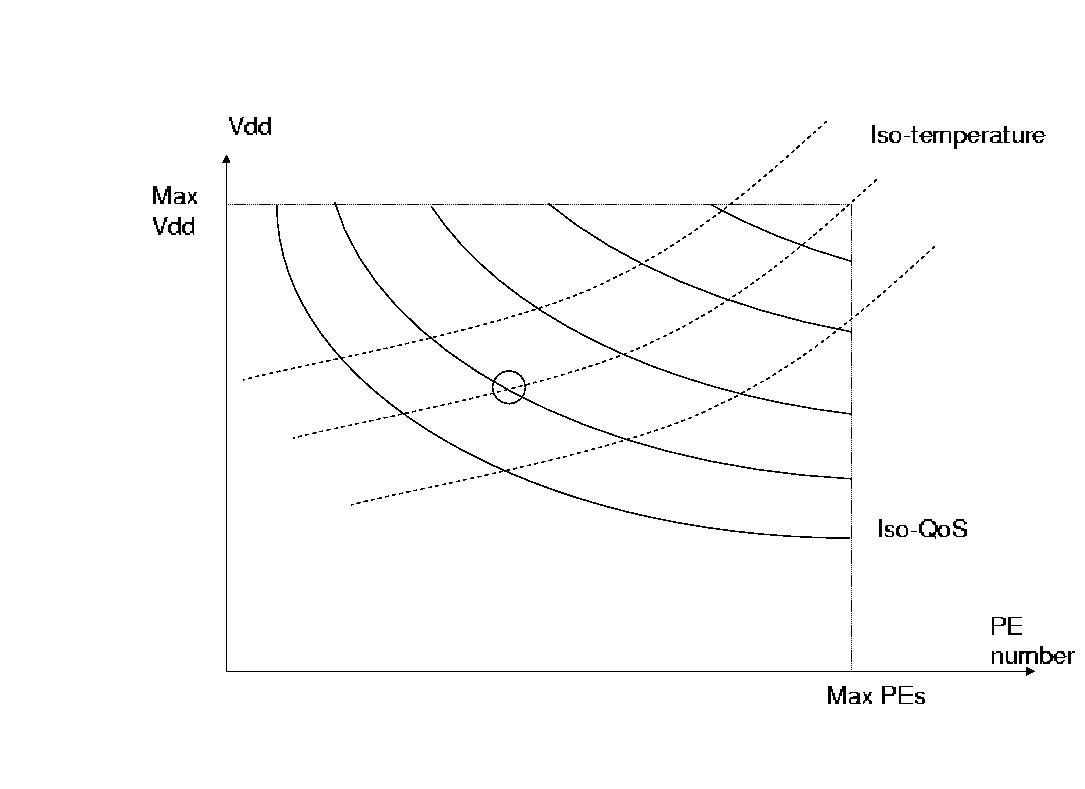
Figure 2: Iso-QoS and iso-temperature Curves.